大多数 Copilot CLI 演示关注的是”你能用它做什么”,而很少有人展示”它自己到底做了什么”。这篇文章要做的恰好相反:通过开启调试日志 + 运行一个 HTTPS 代理,把一次完整的 CLI 请求从终端到 LLM API 再返回的过程,完整地呈现出来。
你会看到实际的 HTTP 请求体、系统提示词有多大、工具列表长什么样、tool_calls 如何触发本地执行、以及两次 API 往返分别传递了哪些内容。
思路
Copilot CLI 本身有一些可观测能力:/usage 显示 token 用量,--share 导出对话,--log-level debug 写入详细日志。这里的方法是把 debug 日志和 mitmweb 结合起来:mitmweb 是一个基于浏览器界面的 HTTPS 代理,能拦截并记录所有 HTTP 流量。
这两种视角互补:调试日志告诉你客户端本地决策了什么,mitmweb 告诉你实际发到 API 的是什么。
前置条件
- GitHub Copilot CLI 已安装(命令:
copilot) - mitmproxy 已安装(
brew install mitmproxy) - 约 5 分钟时间
第一步:搭建调试环境
需要两个终端并行运行。
终端一:启动 mitmweb
mitmweb 会拦截所有 HTTPS 流量,并把捕获的流量持久化到磁盘:
mkdir -p ~/copilot-debug
mitmweb --mode regular --listen-port 8080 \
  --save-stream-file ~/copilot-debug/session.flow
执行后浏览器会自动打开 http://127.0.0.1:8081,这是 mitmweb 的检查界面。
终端二:启动 Copilot CLI
NODE_EXTRA_CA_CERTS=~/.mitmproxy/mitmproxy-ca-cert.pem \
HTTPS_PROXY=http://127.0.0.1:8080 \
copilot --log-level debug --log-dir ~/copilot-debug/
两个环境变量各有用途:
HTTPS_PROXY:让 CLI 的流量经过 mitmwebNODE_EXTRA_CA_CERTS:让 Node.js 信任 mitmweb 的自签名 CA 证书,否则 TLS 握手会失败
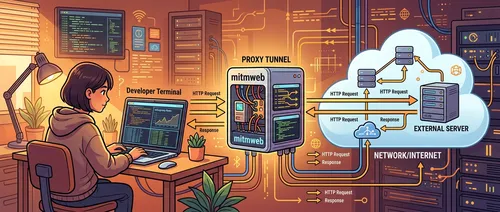
TLS 拦截的结构如下:
Copilot CLI  ──TLS──►  mitmweb  ──TLS──►  api.enterprise.githubcopilot.com
              (mitm CA)           (real CA)
mitmweb 在中间充当透明代理:用自己的 CA 证书终结 CLI 的 TLS 连接,解密流量,然后再用真实 CA 重新发起连接到目标服务器。
第二步:等待初始化完成
在你输入任何内容之前,先观察 CLI 的输出,等到出现类似这样的信息:
Environment loaded: 1 MCP server, 1 plugin, N skills, N agents调试日志(~/copilot-debug/process-*.log)记录了完整的启动序列,包含代理检测、session 注册、workspace 初始化等事件。整个初始化过程大约需要 3 秒。
此时 mitmweb 界面里已经能看到一批初始化请求,这些是 CLI 启动时的预热流量。
第三步:发送提示词
等初始化稳定后,输入一个简单的问题:
> list the files in this directory使用这个提示词的原因是它触发的 agentic loop 足够小——只用一次工具调用就能完成,方便看清完整流程,而不会被多步骤工作流的复杂性干扰。
等 Copilot 完成回应后,终端里能看到 CLI 调用了 bash 工具(显示为 “List current directory”),然后给出了一段文字总结。状态栏显示类似 claude-opus-4.6 (high) (3x) 的信息,表明当前使用的模型和质量档位。
第四步:查看调试日志
在 ~/copilot-debug/process-*.log 里,找到你发送提示词之后的时间戳,重点关注两段事件。
第一次 completion 请求
2026-03-22T16:35:52.030Z [DEBUG] Using model: claude-opus-4.6
2026-03-22T16:35:52.030Z [DEBUG] Using Copilot API at
  https://api.enterprise.githubcopilot.com with integration ID copilot-developer-cli
CLI 发出了第一次 POST /chat/completions,把模型名称和 API 地址记录在本地日志中。
工具执行阶段
LLM 响应到达后,日志里会出现:
2026-03-22T16:35:57.027Z [DEBUG] Tool calls count: 2
2026-03-22T16:35:57.027Z [DEBUG] Running tool calls in parallel
LLM 请求了两个工具调用:report_intent(更新界面状态为”Listing directory contents”)和 bash(运行 ls -la)。两者并行执行。
调试日志到这里展示的是客户端本地的决策过程,下一步用 mitmweb 验证对应的网络流量。
第五步:在 mitmweb 里检查请求
切换到 mitmweb 界面 http://127.0.0.1:8081。
过滤到 Copilot API 域名
在 mitmweb 的搜索栏输入过滤表达式:
~d api.enterprise.githubcopilot.com初始化流量过后,你会看到两条关键的 POST 请求:
| # | 类型 | 路径 | 用途 |
|---|---|---|---|
| 1 | POST | /chat/completions | 主模型请求 → 返回 tool_calls |
| 2 | POST | /chat/completions | 携带工具结果的后续请求 → 返回最终文本 |
第一次 POST 请求体
点开第一条 POST /chat/completions,请求体大致如下:
{
  "model": "claude-opus-4.6",
  "messages": [
    {
      "role": "system",
      "content": "You are the GitHub Copilot CLI, a terminal assistant built by GitHub..."
    },
    {
      "role": "user",
      "content": "<current_datetime>...</current_datetime>\n\nlist the files in this directory"
    }
  ],
  "tools": [
    { "type": "function", "function": { "name": "bash", ... } },
    { "type": "function", "function": { "name": "view", ... } },
    { "type": "function", "function": { "name": "glob", ... } }
    // ...共约 38 个工具定义
  ],
  "stream": true
}
几个关键点:
messages:只有 2 条——系统提示词和用户输入。系统提示词约 9,000 token,包含行为规则、工具使用说明和可用 skill 的元数据。tools:完整的工具 schema 数组,约 12,000 token。bash、view、edit、create、glob、grep、skill、ask_user以及 GitHub MCP server 工具都在其中,每次请求都完整上传。stream: true:响应以text/event-stream流式传输,每个 chunk 是一行data:。
第一次响应:tool_calls
响应体里,LLM 没有直接返回文本,而是请求执行工具:
{
  "choices": [
    {
      "finish_reason": "tool_calls",
      "message": {
        "role": "assistant",
        "content": null,
        "tool_calls": [
          {
            "id": "tooluse_cMgpXCEPUHqgfiVsxYkFqZ",
            "type": "function",
            "function": {
              "name": "report_intent",
              "arguments": "{\"intent\": \"Listing directory contents\"}"
            }
          },
          {
            "id": "tooluse_COXsHEprFxFmdR4rkMg6HX",
            "type": "function",
            "function": {
              "name": "bash",
              "arguments": "{\"command\": \"ls -la\", \"description\": \"List files in current directory\"}"
            }
          }
        ]
      }
    }
  ]
}
finish_reason: "tool_calls" 表示 LLM 在等待工具执行结果,还没有准备好最终答案。CLI 在本地执行这两个工具:report_intent 更新界面状态,bash 运行 ls -la。
第六步:查看工具结果和最终回答
CLI 在本地执行完工具后,把结果发回给 LLM,这是第二次 POST 请求。
后续请求体
第二次请求的 messages 数组从 2 条增长到了 5 条:
{
  "model": "claude-opus-4.6",
  "messages": [
    { "role": "system", "content": "..." },
    { "role": "user", "content": "list the files in this directory" },
    {
      "role": "assistant",
      "content": null,
      "tool_calls": [
        { "id": "tooluse_cMgp...", "function": { "name": "report_intent", ... } },
        { "id": "tooluse_COXs...", "function": { "name": "bash", "arguments": "{\"command\": \"ls -la\"}" } }
      ]
    },
    {
      "role": "tool",
      "tool_call_id": "tooluse_cMgp...",
      "content": "Intent logged"
    },
    {
      "role": "tool",
      "tool_call_id": "tooluse_COXs...",
      "content": "total 0\ndrwxr-xr-x  2 user  staff  64 Mar 22 ...\n..."
    }
  ],
  "stream": true
}
关键变化:
- 消息数从 2 条增长到 5 条,新增了 assistant 的
tool_calls响应和两条tool结果 - 每个
tool_call_id把工具结果精确关联回对应的工具调用 bash工具结果包含了你机器上实际执行ls -la的输出
最终响应
第二次请求的响应是一条普通文本,finish_reason 变成了 "stop":
{
  "choices": [
    {
      "message": {
        "role": "assistant",
        "content": "The directory is empty — no files or subdirectories present (only . and ..)."
      },
      "finish_reason": "stop"
    }
  ]
}
这就是最终显示在终端里的答案。agentic loop 到此完成。
完整流程
把上面所有步骤压缩成一张时序图:
终端输入提示词
    │
    ▼
POST /chat/completions (2 messages + 38 tools)
    │
    ▼
LLM 响应 → finish_reason: "tool_calls"
    │
    ▼
CLI 本地执行:report_intent + bash (ls -la)
    │
    ▼
POST /chat/completions (5 messages,含工具结果)
    │
    ▼
LLM 响应 → finish_reason: "stop" → 最终文本
两次 POST 往返,一次本地命令执行,这就是一个简单请求的完整链路。
小结
这个调试环境的价值在于把”agentic”这个抽象概念变成了可检查的具体序列。调试日志告诉你客户端本地在做什么决定,mitmweb 告诉你实际发到 API 的是什么、API 又返回了什么。
对于这个简单提示词,链路干净清晰:初始化会话 → 发送系统提示词 + 用户输入 + 工具 schema → 收到 tool_calls → 本地执行工具 → 发送工具结果 → 渲染最终回答。
一旦你在这个最小案例上建立了清晰的心智模型,调试更长的会话、解释意外的工具选择、追踪多轮对话里的上下文累积,就都变得可预测了。